Breakout Detection by Twitter
by Eric Bunch
Posted on 02 Mar 2016
This post is about Twitter's breakout detection package. This is a statistical package originally written in R that detects breakouts, which are also called level shifts or jumps in time series data. A level shift in time series data is not something that is extremely well defined, but is more or less a significant change in mean in the time series data that persists for a significant amount of time. I have been looking at some time series data lately, and there is a need to systematically detect when level shifts occur; I am looking at thousands of time series', and need to check for new breakouts each day. This is something that would be great if it could be automated.
There are multiple libraries in R that can detect level shifts, including tsoutliers and changepoint in addition to BreakoutDetection. I have done some comparative analysis of these few packages $\text{(although there are surely more)}$, and I have found that the breakout detection package is the best suited for my purposes. I'm not going to go into the comparison in this post, but will simply focus on the breakout detection package.
I won't go into the math behind breakout detection, but it's pretty interesting. The method combines E-statistics $\text{(Energy Statistics)}$, and Robust Statistics. In section 8 of this paper gives a brief discussion on the reasoning behind energy statistics.
Now I'll talk a bit about how to utilize the package. I'll describe how to use the version ported over to Python. First, clone the project from github here. Before the next step, I recommend creating a virtual environment and activating it before installing the breakout detection package. After the repository is cloned, cd into the directory BreakoutDetection/Python. Then execute the following three commands $\text{(this is also on the github repository under Python: How to get started)}$
swig -python -c++ breakout_detection.i
python setup.py build_ext -I../src build
sudo python setup.py build_ext -I../src install
$\text{(if you are in a virtualenv, then leave off the sudo of the last command)}$. Then to use this package in a python script, you must import breakout_detection
The following is an example of how to use the breakout detection package. It's using the breakout detection package on the S&P500 index to detect breakouts. The index is tracked from Jan. 4, 2010.
import pandas as pd
import breakout_detection
import pandas.io.data as web
import matplotlib.pyplot as plt

plt.style.use('fivethirtyeight')
edm_multi = breakout_detection.EdmMulti()
snp = web.DataReader('^GSPC', 'yahoo')
max_snp = max(max(snp['Open']),1)
Z = [x/float(max_snp) for x in snp['Open']]
edm_multi.evaluate(Z, min_size=64, beta=0.0001, degree=1)
snp['Open'].plot(figsize=(30,10))
for i in edm_multi.getLoc():
    plt.axvline(snp['Open'].index[i], color='#FF4E24')
This gives the following graph
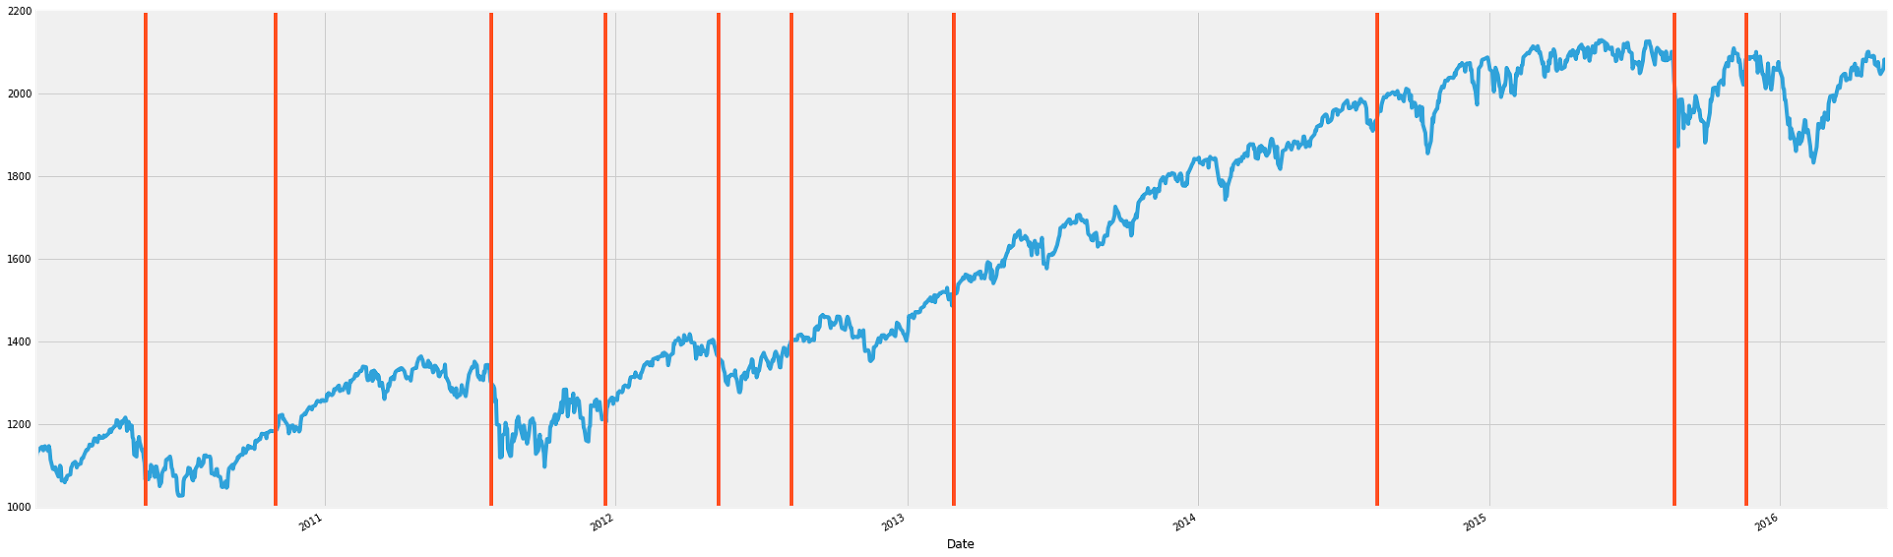
I think it works pretty well! The beta parameter is a kind of penalization threshold. Higher values will result in less breakout points. The min_size parameter acts like a kind of periodicity constraint. Once a breakout point is detected, another cannot be detected within min_size units of time $\text{(or whatever is on the x-axis)}$. This also means that a breakout point cannot be detected in the first min_size units on the x-axis. I chose 64 for min_size because that's roughly the amount of days in a quarter, and I figured a meaningful shift in the S&P500 index would happen in a quarter. The degree parameter can take values 0, 1, or 2. Degree = 0 will not impose any penalization of detection of breakout points--it will even cancel out the beta parameter. Degree = 1 will have a penalization effect, and will not have two breakout points too close to another. Degree = 2 will have a heavier penalization for closeness of breakout points.