The Simpsons' Best Episode Ever by the Data
by Eric Bunch
Posted on 03 Aug 2017
![]()
The Simpsons is one of the longest-running shows on television, and a piece of American culture. I personally grew up on The Simpsons, and am still a big fan. Not too long ago, Kaggle put up a data set on The Simpsons, and I thought it would be fun to explore it!
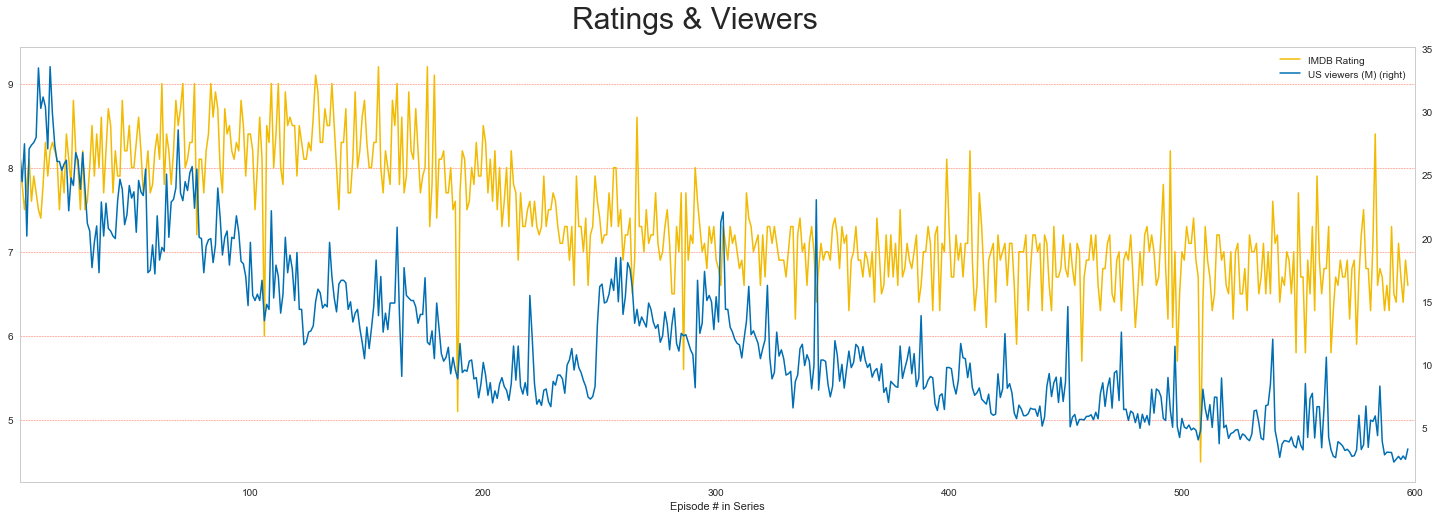
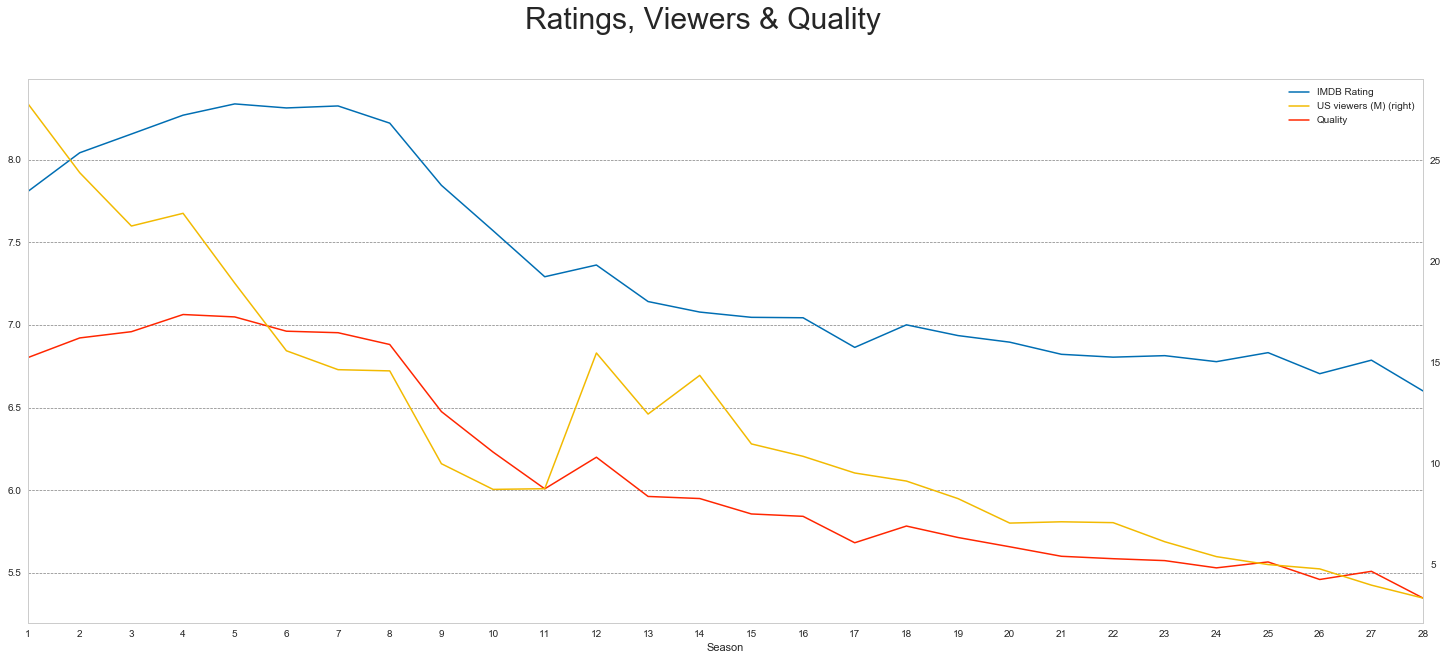
Even if you haven’t seen all 618 (as of this post!) episodes of The Simpsons, you probably know that it has passed it’s prime. Below is a the graph of IMDB Ratings and Number of U.S. Viewers in millions. There are some curious things to note about this graph. I was surprised that the number of viewers was so high in the first few seasons, and that it has almost steadily declined since then. The curious jump in viewers around Episode 250 occurred at the start of Season 12, which is when the show switched from airing starting in September, to start in November, as well as beginning the tradition of starting the season with the Halloween “Treehouse of Horror” episode. The IMDB Ratings increase slightly over time, until a little before Episode 200–somewhere during Season 9, and then declines steadily for a while, and levels out.
In this post, we will explore some basic questions about the data, and then we will try to answer the question “Which is the best (and worst) episode of The Simpsons?” by combining the IMDB Ratings with the number of U.S. viewers.
Spoken word count
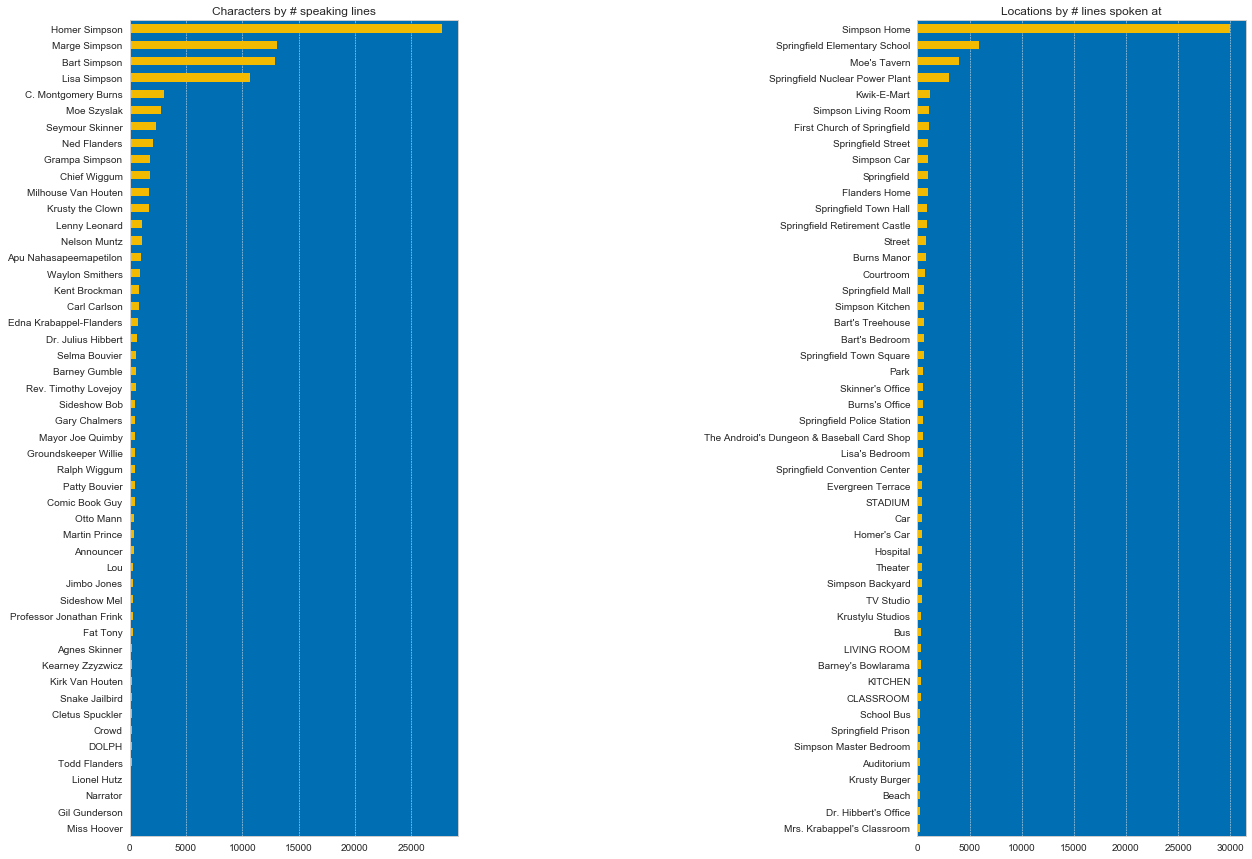
Let’s take a quick look at the number of lines spoken by character, as well as the location they were spoken. First, let’s look at a simple bar chart counting up the totals. As we can see, the discrepancy between the number of lines Homer has far outstrips even the rest of the Simpsons family. The same can be said of the number of lines spoken at the Simpsons’ home and the other locations in the show.
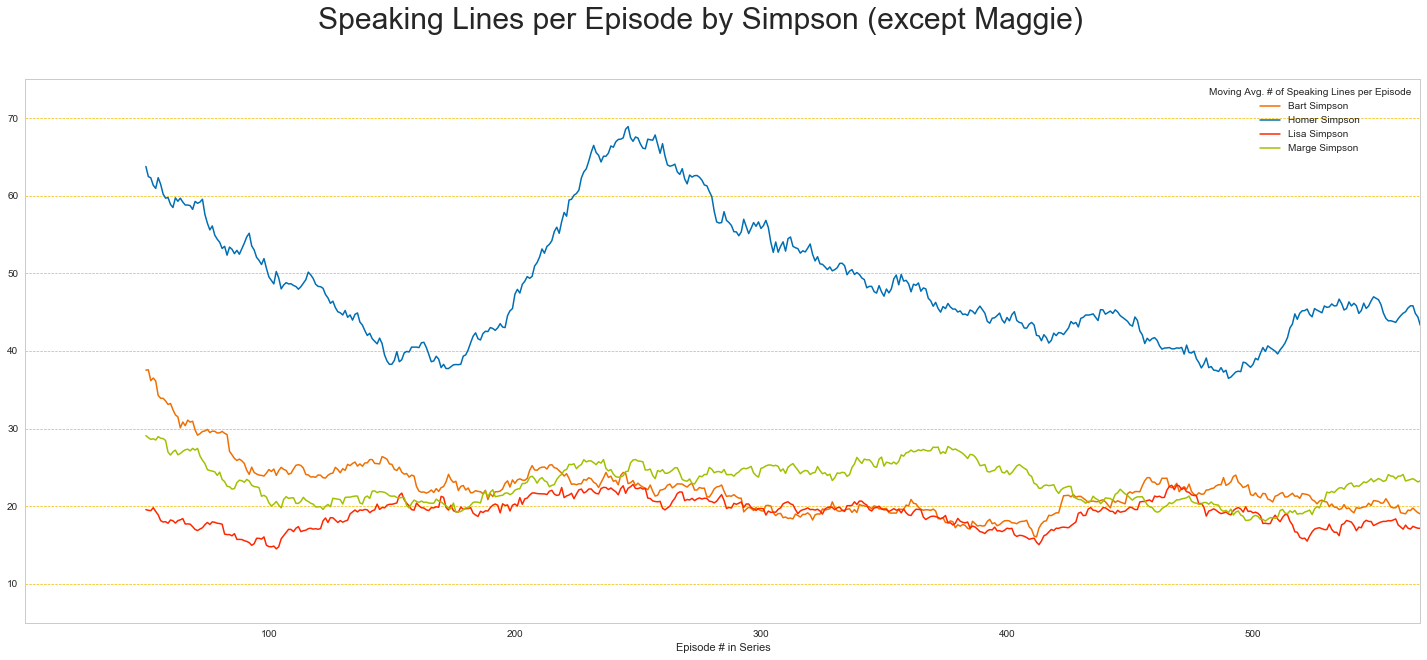
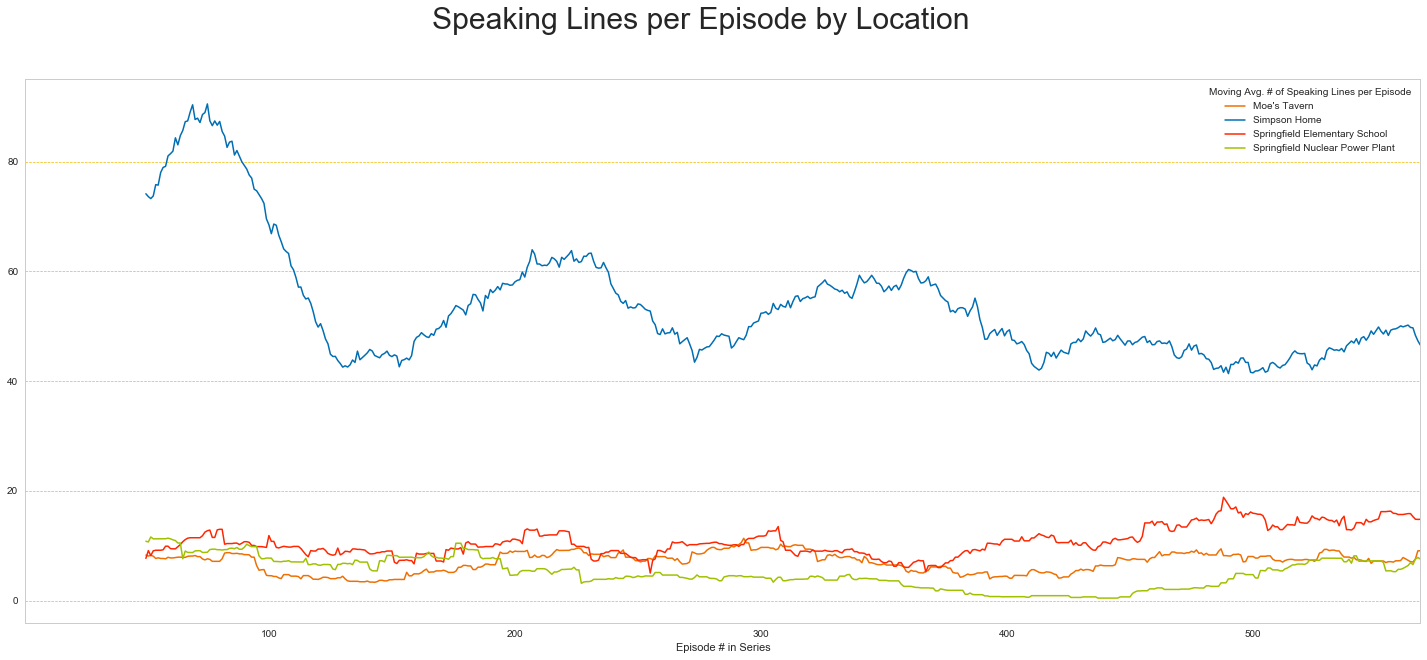
In the graphs below, we can see that the counts above persist over the seasons. There are a few curious things about the two plots below. We can see that the number of speaking lines that Homer had drastically increased a little before Episode 200–somewhere around Season 9. Around the same time, the number of lines spoken at the Simpsons’ Home decreased significantly. This is the same time frame where the IMDB Ratings of the show decreased significantly. One hypothesis one could form based on these graphs is that the suffering reviews were a result of more Homer-centric episodes, following the locations he goes to.
Episode Quality
Now, we’ll try to come up with a definitive Simpsons Best Episode Ever. To do this, we will use a weighted sum of the IMDB Rating and the (scaled) U.S. viewers in millions. This is to balance out the more specialized ratings that IMDB gives with the more populist vote that people gave with their TV time. Here, we weight the IMDB rating 80% and the U.S. viewers in millions 20% to yield the metric we will call Episode “Quality”.
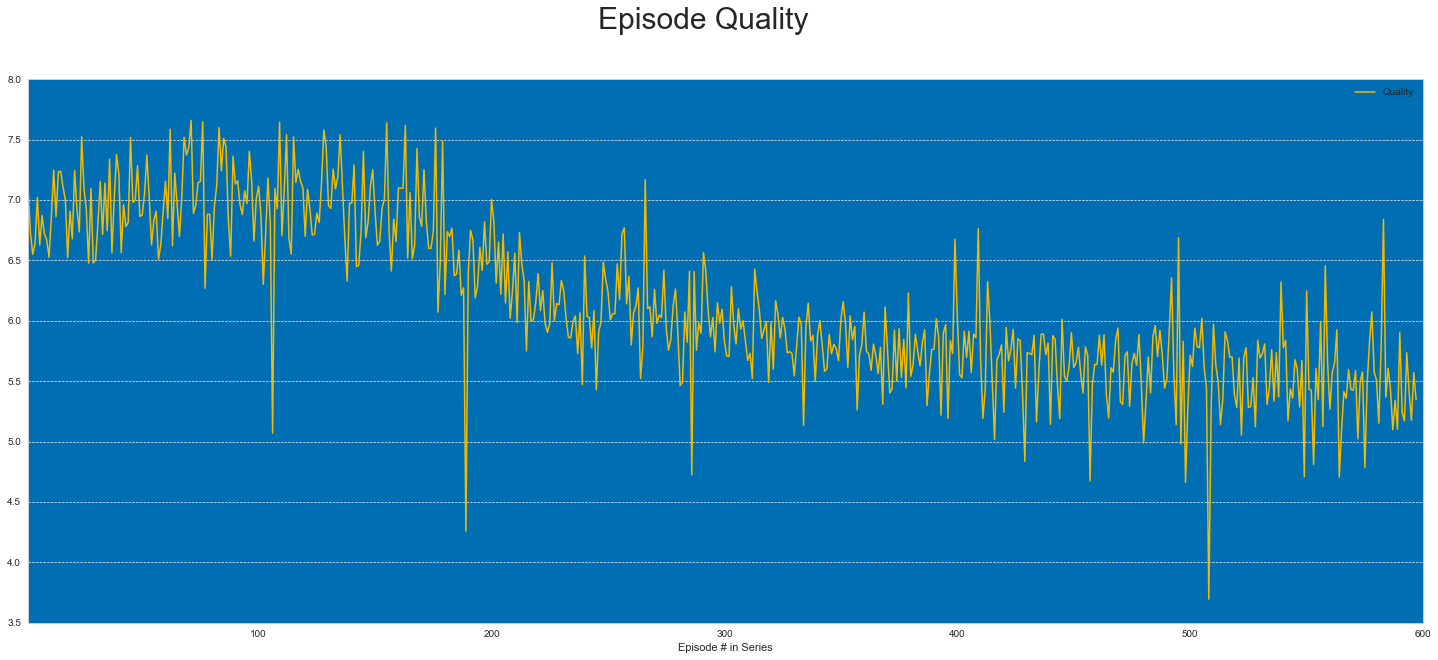
There are a few interesting things about the Quality graph above. We can see there is a significant dip in quality a little after Episode 200 (around Season 9 or 10)– the Best Episode Ever will be before this point. In addition, there are a few episodes that have sharp spikes downward relative to the other Episodes of their time. In the graph below, we have marked the Best Episode Ever, as well as these curious negative outliers.
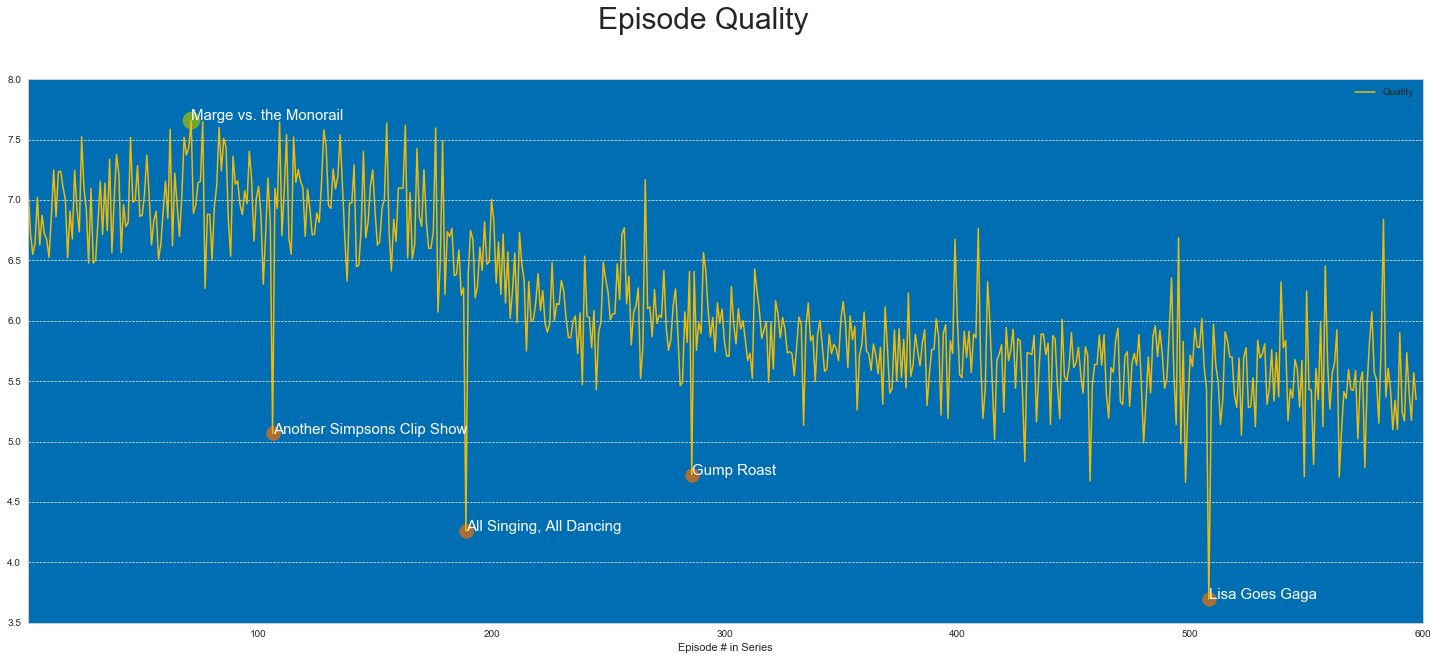
As the graph above shows, The Simpsons’ Best Episode Ever is:
Marge vs. the Monorail!
This Episode aired in 1993 during Season 4, featuring Marge as the main protagonist. During the episode the town of Springfield comes into a financial windfall, and calls a town meeting to decide how to spend the money. Marge suggests they use the money to fix up their roads. Instead, the townspeople were won over by a fast-talking salesman, Lyle Lanley (voiced by Phil Hartman), and decided to built a Monorail. Later, Marge investigates and discovers that the salesman Lyle is a conman, the Monorail is shoddily built, and extremely unsafe.
The other four episodes marked are
- Another Simpsons Clip Show $\text{(1994, Season 6)}$
- All Singing, All Dancing $\text{(1998, Season 9)}$
- Gump Roast$\text{(2002, Season 13)}$
- Lisa Goes Gaga $\text{(2012, Season 23)}$
Three of these shows $\text{(Another Simpsons Clip Show, All Singing, All Dancing & Gump Roast)}$ are essentially clip shows, so understandably had lower quality. The Episode Lisa Goes Gaga is in fact the Episode with the lowest quality $\text{(Worst Episode Ever!)}$. This Episode has featured guest Lady Gaga, who comes to Springfield and takes it upon herself to cheer up the whole town. She takes a particular interest in Lisa. Lady Gaga eventually helps Lisa learn to appreciate herself for who she is, and then the two perform a duet together.
Below are the top 10 Episodes by quality $\text{(my personal favorite comes in at #4: You Only Move Twice)}$.
| Title | Original air date | Season | Episode # in Season | US viewers (M) | IMDB Rating | Quality |
|---|---|---|---|---|---|---|
| Marge vs. the Monorail | 1993-01-14 | 4 | 12 | 23.0 | 9.0 | 7.660 |
| Last Exit to Springfield | 1993-03-11 | 4 | 17 | 22.4 | 9.0 | 7.648 |
| Treehouse of Horror V | 1994-10-30 | 6 | 6 | 22.2 | 9.0 | 7.644 |
| You Only Move Twice | 1996-11-03 | 8 | 2 | 13.9 | 9.2 | 7.638 |
| The Springfield Files | 1997-01-12 | 8 | 10 | 20.9 | 9.0 | 7.618 |
| Cape Feare | 1993-10-07 | 5 | 2 | 20.0 | 9.0 | 7.600 |
| Homer's Enemy | 1997-05-04 | 8 | 23 | 11.8 | 9.2 | 7.596 |
| Homer the Heretic | 1992-10-08 | 4 | 3 | 19.3 | 9.0 | 7.586 |
| Who Shot Mr. Burns? (Part One) | 1995-05-21 | 6 | 25 | 15.0 | 9.1 | 7.580 |
| Homer Badman | 1994-11-27 | 6 | 9 | 17.0 | 9.0 | 7.540 |
Below we have the plot of IMDB Ratings, U.S. viewers in millions, and Quality aggregated by Season and averaged. Below the graph we can have the top 10 Seasons ranked by IMDB Rating, U.S. viewers in Millions, and Quality.
| Season | IMDB Rating | US viewers (M) | Quality |
|---|---|---|---|
| 5 | 8.336364 | 18.940909 | 7.047909 |
| 7 | 8.324000 | 14.660000 | 6.952400 |
| 6 | 8.312000 | 15.596000 | 6.961520 |
| 4 | 8.268182 | 22.395455 | 7.062455 |
| 8 | 8.220000 | 14.600000 | 6.881091 |
| 3 | 8.154167 | 21.766667 | 6.958667 |
| 2 | 8.040909 | 24.404545 | 6.920818 |
| 9 | 7.844000 | 10.008000 | 6.475360 |
| 1 | 7.807692 | 27.807692 | 6.802308 |
| 10 | 7.569565 | 8.737391 | 6.230400 |
| Season | IMDB Rating | US viewers (M) | Quality |
|---|---|---|---|
| 1 | 7.807692 | 27.807692 | 6.802308 |
| 2 | 8.040909 | 24.404545 | 6.920818 |
| 4 | 8.268182 | 22.395455 | 7.062455 |
| 3 | 8.154167 | 21.766667 | 6.958667 |
| 5 | 8.336364 | 18.940909 | 7.047909 |
| 6 | 8.312000 | 15.596000 | 6.961520 |
| 12 | 7.361905 | 15.485714 | 6.199238 |
| 7 | 8.324000 | 14.660000 | 6.952400 |
| 8 | 8.220000 | 14.600000 | 6.881091 |
| 14 | 7.077273 | 14.378182 | 5.949382 |
| Season | IMDB Rating | US viewers (M) | Quality |
|---|---|---|---|
| 4 | 8.268182 | 22.395455 | 7.062455 |
| 5 | 8.336364 | 18.940909 | 7.047909 |
| 6 | 8.312000 | 15.596000 | 6.961520 |
| 3 | 8.154167 | 21.766667 | 6.958667 |
| 7 | 8.324000 | 14.660000 | 6.952400 |
| 2 | 8.040909 | 24.404545 | 6.920818 |
| 8 | 8.220000 | 14.600000 | 6.881091 |
| 1 | 7.807692 | 27.807692 | 6.802308 |
| 9 | 7.844000 | 10.008000 | 6.475360 |
| 10 | 7.569565 | 8.737391 | 6.230400 |